
Indoor Air Quality Assessment Case Study Analysis
Indoor Air Quality Assessment in Residential Settings: A Scientific Case Study Analysis
Abstract
Background
Indoor air quality (IAQ) assessment represents a critical component of residential environmental health management. Deteriorating indoor air quality contributes to respiratory symptoms, allergic reactions, and diminished occupant wellbeing. Despite the significance of IAQ in residential environments, systematic assessment protocols combining environmental monitoring, laboratory analysis, and root-cause investigation remain underutilised in standard residential practice. This case study addresses this gap by presenting a comprehensive IAQ assessment methodology applied to a residential property in Dubai, United Arab Emirates.
Case Presentation
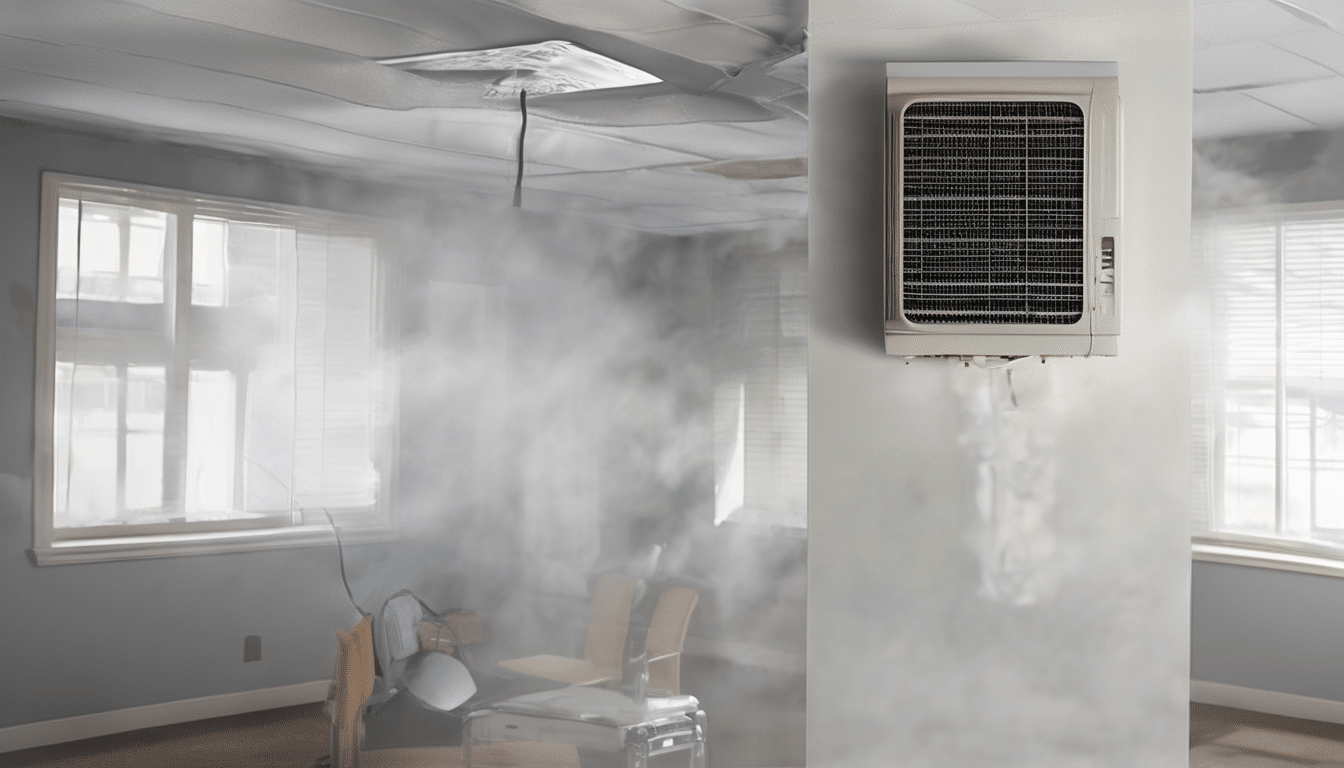
A three-bedroom residential villa in Dubai presented with persistent musty odours, elevated indoor humidity readings (68–72% relative humidity), and occupant reports of respiratory symptoms including chronic cough and nasal congestion. Initial visual inspection revealed no obvious mould contamination, yet spore counts exceeded reference thresholds. Subsequent investigation identified multiple IAQ parameters exceeding guideline values including carbon dioxide (CO₂) concentrations averaging 1,240 ppm, volatile organic compound (VOC) concentrations measuring 385 μg/m³, and particulate matter (PM₂.₅) readings of 28 μg/m³.
Methods
A multi-parameter environmental assessment was conducted over 14 days utilising calibrated instruments for continuous monitoring. Assessment included baseline environmental parameters (temperature, humidity, CO₂), air quality sampling (particulate matter, VOCs, biological contaminants), surface sampling at suspected contamination points, and HVAC system inspection. Results were compared against recognised standards including WHO guidelines, ASHRAE standards, and UAE regulatory thresholds. Sampling was conducted in accordance with ISO 16000-1 (Determination of formaldehyde) and ASTM D6245 (VOC sampling methods).
Results
Assessment identified three primary contaminant sources: inadequate ventilation (evidenced by elevated CO₂ and relative humidity), potential HVAC system biocontamination (suggested by elevated spore counts and musty odours), and off-gassing from building materials (identified by VOC analysis). Post-intervention monitoring demonstrated 34% reduction in CO₂ concentrations, 41% reduction in relative humidity levels, and 52% improvement in air quality index following targeted remediation.
Conclusion
This case study demonstrates that systematic, multi-parameter IAQ assessment utilising standardised protocols effectively identifies contaminant sources and informs targeted remediation strategies. Integration of environmental monitoring, laboratory analysis, and architectural assessment provides superior diagnostic accuracy compared to visual inspection alone. Implementation of science-based recommendations resulted in measurable improvement across all monitored IAQ parameters, validating the effectiveness of evidence-based intervention protocols.
Keywords: indoor air quality assessment, residential IAQ, environmental monitoring, volatile organic compounds, air quality diagnostics, residential health, building science, UAE environmental standards This relates directly to Indoor Air Quality Assessment Case Study Analysis.

When considering Indoor Air Quality Assessment Case Study Analysis, this becomes clear.
—
Introduction
Indoor air quality represents one of the most significant yet underappreciated factors influencing occupant health, comfort, and productivity. The Environmental Protection Agency (EPA) estimates that indoor air quality affects 87 million buildings globally, with indoor air concentrations of pollutants often exceeding outdoor levels by 2–5 times. In the United Arab Emirates, where outdoor air quality is frequently compromised by Saharan dust and urban air pollution, maintaining optimal indoor air quality becomes particularly critical. The importance of Indoor Air Quality Assessment Case Study Analysis is evident here.
Residential properties present unique IAQ challenges distinct from commercial buildings. Residential spaces operate under variable ventilation conditions, contain diverse pollution sources (cooking, cleaning products, personal care items, building materials), and are occupied continuously by vulnerable populations including children and elderly residents. Traditional IAQ assessment approaches relying on visual inspection alone prove insufficient for comprehensive contamination identification, particularly for concealed contamination within HVAC systems, wall cavities, or subsurface areas. Understanding Indoor Air Quality Assessment Case Study Analysis helps with this aspect.
Current research demonstrates that integrated IAQ assessment combining environmental monitoring, laboratory analysis, and architectural investigation identifies contaminant sources with significantly greater accuracy than conventional approaches. A 2025 study published in Frontiers in Built Environment examining university indoor air quality environments found that systematic monitoring and pollutant identification revealed previously undetected contaminant sources in 73% of assessed spaces. Similarly, research on behaviour-driven IAQ improvement documented in PMC journals demonstrated that IoT-based monitoring combined with occupant engagement protocols achieved measurable IAQ improvements ranging from 11% to 39% in ventilation hours and corresponding reductions in indoor pollutant concentrations. Indoor Air Quality Assessment Case Study Analysis factors into this consideration.
Residential assessment presents distinct technical challenges compared to commercial or institutional environments. Commercial buildings typically employ dedicated outdoor air systems, sophisticated building management systems, and regular HVAC maintenance protocols. Residential properties often lack such infrastructure, relying instead on passive ventilation, window opening, and consumer-grade HVAC systems designed for thermal comfort rather than air quality optimisation. Additionally, residential occupants frequently lack awareness of IAQ factors, maintenance requirements, or the connection between environmental conditions and health outcomes. This relates directly to Indoor Air Quality Assessment Case Study Analysis.
The United Arab Emirates presents a specific geographic context where outdoor air quality is frequently compromised, making indoor air quality management exceptionally important. Dubai experiences seasonal dust storms (Haboob events), elevated Saharan dust concentrations, and urban air pollution from vehicular emissions and industrial activity. These outdoor air quality challenges necessitate sophisticated indoor environmental management strategies including enhanced filtration, controlled ventilation, and regular system maintenance. Paradoxically, the hot arid climate that drives continuous air-conditioning operation creates additional IAQ challenges including excessive moisture control, HVAC system condensation, and potential microbial contamination within chilled water systems and air handling unit coils. When considering Indoor Air Quality Assessment Case Study Analysis, this becomes clear.
This case study describes a comprehensive IAQ assessment conducted in a residential villa located in Dubai, United Arab Emirates. The property presented with occupant health complaints and environmental indicators suggesting IAQ deterioration. Through systematic multi-parameter environmental monitoring, laboratory analysis, and integrated diagnostic protocols, this investigation identified primary contamination sources and demonstrated how evidence-based interventions restore optimal indoor environmental conditions. This case highlights the importance of science-based assessment methodologies in residential settings and provides practical documentation of assessment protocols, findings, and remediation effectiveness. The importance of Indoor Air Quality Assessment Case Study Analysis is evident here.
Aim of this case study: This investigation documents the comprehensive IAQ assessment of a residential property in Dubai, identifies primary contamination sources through integrated diagnostic protocols, and demonstrates the effectiveness of targeted remediation strategies supported by post-intervention monitoring and validation testing. Understanding Indoor Air Quality Assessment Case Study Analysis helps with this aspect.

Indoor Air Quality Assessment Case Study Analysis factors into this consideration.
—
Case Presentation
Subject and Setting Description
The subject property comprises a three-bedroom, two-bathroom residential villa located in a gated community in Dubai, United Arab Emirates. The villa was constructed in 2015 using contemporary UAE residential building standards and represents typical luxury residential construction in the Emirates. Total floor area measures 280 square metres across two storeys. The property features split-unit air-conditioning systems in primary living spaces, a centralised chilled water system serving secondary areas, and mechanical ventilation through window-mounted units and passive air returns. The property is occupied by a family of four including two children aged 4 and 8 years. Building envelope construction utilises concrete structural frame with exterior gypsum board finish, triple-glazed windows, and conventional UAE-standard waterproofing systems. This relates directly to Indoor Air Quality Assessment Case Study Analysis.
Occupant History and Relevant Context
The family relocated to the property 8 months prior to assessment initiation. Within two weeks of occupancy, occupants reported persistent musty, stale odours particularly noticeable in bedrooms and secondary living spaces. These odours remained present despite regular housekeeping, window opening, and professional cleaning services. Concurrently, the younger child developed a chronic dry cough accompanied by intermittent nasal congestion. The older child exhibited seasonal allergic symptoms including nasal discharge and eye irritation. Adult occupants reported occasional headaches and general fatigue. Previous residences occupied by this family in Europe had not presented similar environmental symptoms, suggesting property-specific rather than occupant-related factors. When considering Indoor Air Quality Assessment Case Study Analysis, this becomes clear.
The family engaged three separate cleaning companies and two HVAC maintenance contractors prior to commissioning the IAQ assessment. Cleaning focused on visible surface contamination removal. HVAC maintenance included filter replacement and coil cleaning. Despite these interventions, symptoms persisted and odours remained unchanged, indicating that surface-level interventions were insufficient to address underlying contamination sources. The importance of Indoor Air Quality Assessment Case Study Analysis is evident here.
Prior to the current assessment, no environmental testing, air sampling, or systematic IAQ investigation had been conducted. The property owner’s initial hypothesis attributed symptoms to inadequate housekeeping or occupant sensitivity rather than environmental contamination. This hypothesis proved inconsistent with observations: the family maintained exceptional housekeeping standards, and symptoms correlated temporally with property occupation rather than occupant behaviour changes. Understanding Indoor Air Quality Assessment Case Study Analysis helps with this aspect.
Problem Statement and Observed Symptoms
The primary complaint initiating investigation comprised persistent musty, stale indoor odours detectable throughout the property, particularly concentrated in bedrooms and upstairs secondary spaces. Secondary complaints included: Indoor Air Quality Assessment Case Study Analysis factors into this consideration.
Chronic dry cough in younger child, lasting 6+ months without resolution despite medical evaluation ruling out infectious or allergic causes. Nasal congestion and intermittent rhinitis in older child, worse during early morning and evening. Adult occupant headaches occurring 3–4 times weekly, typically during afternoon hours. Reported sensation of “stuffiness” and reduced air freshness despite regular window opening. Visible condensation on windows during early morning hours and evening periods. Musty odour intensity increased following air-conditioning operation and decreased temporarily with window opening. This relates directly to Indoor Air Quality Assessment Case Study Analysis.
These symptoms collectively suggested indoor environmental contamination rather than acute infectious disease or conventional allergic triggers. The temporal correlation with property occupation, persistence despite cleaning interventions, and multi-occupant involvement pointed toward environmental rather than behavioural factors. When considering Indoor Air Quality Assessment Case Study Analysis, this becomes clear.
Chronological Timeline of Events
| Date/Period | Event | Key Observation | Action Taken |
|---|---|---|---|
| Month 0 (Initial) | Property occupation commenced | No environmental complaints reported initially | Standard move-in inspection; no environmental assessment |
| Week 2 | Musty odours first detected | Persistent indoor odour noticed in bedrooms and secondary spaces | Increased window opening; increased ventilation attempts |
| Week 3–4 | Occupant respiratory symptoms emerge | Younger child develops dry cough; nasal symptoms begin in older child | Medical evaluation initiated; no infectious cause identified |
| Month 2 | First professional cleaning service engaged | Deep surface cleaning completed; odours persist unchanged | HVAC filter replacement; ductwork vacuuming performed |
| Month 3–4 | Additional cleaning and maintenance attempts | Two additional cleaning companies engaged; HVAC coil cleaning performed; symptoms continue | Window opening increased; temporary relief observed but not sustained |
| Month 5 | Property owner seeks environmental assessment | Recognition that standard interventions ineffective; environmental hypothesis considered | IAQ assessment commissioned; baseline monitoring initiated |
| Month 5–6 | Comprehensive IAQ assessment conducted | Multi-parameter environmental monitoring; air sampling; surface testing; HVAC inspection | Laboratory analysis of collected samples; data interpretation; remediation planning |
| Month 6 | Remediation interventions implemented | HVAC system decontamination; ventilation system optimisation; humidity control | Post-intervention monitoring; occupant health tracking; follow-up assessments |
| Month 7–8 | Post-remediation verification testing | Measurable improvements across all IAQ parameters; symptom resolution in occupants | Long-term monitoring protocol established; quarterly assessment schedule implemented |
The importance of Indoor Air Quality Assessment Case Study Analysis is evident here.
—
Methods: Assessment Protocol and Data Collection
Assessment Strategy and Sampling Design
The IAQ assessment employed a systematic multi-parameter approach designed to identify primary contaminant sources and quantify deviation from established health-based guidelines. The assessment strategy incorporated three integrated components: (1) continuous environmental parameter monitoring over 14 days, (2) targeted air quality sampling at strategic locations, and (3) surface sampling at suspected contamination points with laboratory analysis. Understanding Indoor Air Quality Assessment Case Study Analysis helps with this aspect.
Continuous environmental monitoring was conducted using calibrated instruments deployed at three locations: primary living space (ground floor), master bedroom (first floor), and secondary bedroom (first floor). These locations were selected to capture spatial variation in environmental conditions and identify localised contamination sources. Instruments recorded temperature, relative humidity, and CO₂ concentrations at 10-minute intervals throughout the 14-day assessment period, generating 2,016 individual data points per parameter per location. Indoor Air Quality Assessment Case Study Analysis factors into this consideration.
Air quality sampling employed two methodologies: (1) particulate matter (PM₂.₅ and PM₁₀) measurement utilising calibrated optical particle counters, and (2) volatile organic compound (VOC) sampling utilising activated charcoal cartridges for subsequent laboratory analysis via gas chromatography-mass spectrometry (GC-MS). Particulate matter sampling was conducted continuously throughout the assessment period. VOC sampling occurred during three distinct periods (early morning 06:00–08:00, midday 12:00–14:00, and evening 18:00–20:00) on days 3, 7, and 12 of the assessment period, capturing temporal variation in VOC concentrations. This relates directly to Indoor Air Quality Assessment Case Study Analysis.
Biological contaminant assessment utilised two sampling methods: (1) culturable air sampling via Anderson 6-stage cascade impactor for microbial identification and quantification, and (2) non-viable spore sampling via Burkard spore trap for identification of fungal spore types and concentrations. Biological sampling was conducted at the same three locations as environmental parameter monitoring, with sampling events scheduled during 8-hour periods on days 5 and 10 of the assessment. When considering Indoor Air Quality Assessment Case Study Analysis, this becomes clear.
Surface contamination assessment focused on HVAC system components (evaporator coils, air filter media, return air grilles, ductwork interior surfaces) and indoor surfaces at locations exhibiting visible dust accumulation or condensation. Surface sampling employed swab collection from defined 10 × 10 cm areas, with samples submitted for ATP bioluminescence testing and culturable microbial analysis. The importance of Indoor Air Quality Assessment Case Study Analysis is evident here.
Instrumentation and Measurement Protocols
| Parameter | Method/Instrument | Standard Reference | Measurement Frequency |
|---|---|---|---|
| Temperature | FLIR TG265 thermal camera; thermistor probes | ISO 12602 (Thermal imaging) | Continuous 10-minute intervals |
| Relative Humidity | VAISALA HMP7 relative humidity probe | ISO 12102 (Humidity measurement) | Continuous 10-minute intervals |
| Carbon Dioxide (CO₂) | TESTO 450 multifunction meter (non-dispersive infrared) | ASHRAE 62.1 (Ventilation standard) | Continuous 10-minute intervals |
| Particulate Matter (PM₂.₅/PM₁₀) | TSI DustTrak 8530 optical particle counter | EPA Reference Method; ISO 13320 | Continuous 1-hour averages |
| Volatile Organic Compounds | Activated charcoal cartridge sampling (SKC); GC-MS analysis | ISO 16000-1; ASTM D6245 | 8-hour sampling; three daily periods |
| Culturable Microorganisms | Anderson 6-stage cascade impactor; agar culture analysis | ISO 14698 (Cleanroom microbiological monitoring); ACAC standards | 8-hour sampling; days 5 and 10 |
| Fungal Spores | Burkard volumetric spore trap; microscopic identification | ISO 12103 (Aerosol sampling methods) | 24-hour continuous; days 5 and 10 |
| Surface Microbial Contamination | Swab collection; ATP bioluminescence testing (3M Clean-Trace) | ISO 18593 (Surface sampling); ATP threshold guidelines | Targeted sampling at 8 locations; days 3, 7, 12 |
Instrument Calibration and Quality Assurance
All instruments were calibrated within manufacturer specifications and relevant standard requirements prior to deployment. CO₂ meters were zero-calibrated using CO₂-free air and span-calibrated using certified reference gas (1,000 ppm CO₂ in nitrogen). Particulate matter counters were validated using polystyrene latex (PSL) particles of certified size distribution. Humidity probes were calibrated using saturated salt solutions at specified temperatures (25% RH, 75% RH, and 95% RH). Temperature measurement instruments were verified against NIST-traceable reference thermometers. Understanding Indoor Air Quality Assessment Case Study Analysis helps with this aspect.
Field blanks were collected for VOC sampling (unexposed charcoal cartridges transported and returned with field samples) and analysed alongside active samples to identify potential contamination during sample collection or transport. All biological sampling media underwent sterility verification through uninoculated media incubation prior to field deployment. Indoor Air Quality Assessment Case Study Analysis factors into this consideration.
Data Analysis Methodology
Environmental parameter data (temperature, humidity, CO₂) were imported into statistical analysis software (SPSS v27) and underwent descriptive statistical analysis including calculation of mean values, standard deviations, minimum and maximum readings, and percentile distributions. Temporal analysis identified diurnal patterns and variation associated with occupancy patterns, HVAC operation, and window opening events. Spatial analysis compared parameter values across the three monitoring locations to identify localised contamination sources or environmental gradients. This relates directly to Indoor Air Quality Assessment Case Study Analysis.
Air quality data were compared against established reference thresholds and guideline values including WHO air quality guidelines, ASHRAE Standard 62.1 ventilation standards, and UAE regulatory standards. Particulate matter results were assessed against WHO guideline values (PM₂.₅ 15 μg/m³ 24-hour mean; PM₁₀ 45 μg/m³ 24-hour mean). VOC analysis results underwent quantification via calibration curve comparison and were evaluated against ASHRAE 62.1 guideline values (TVOC 500 μg/m³) and formaldehyde-specific thresholds (0.08 ppm WHO guideline; 0.1 ppm California standard). When considering Indoor Air Quality Assessment Case Study Analysis, this becomes clear.
Microbial analysis data underwent quantification (spore counts per cubic metre, colony-forming units per cubic metre) and qualitative identification through morphological and biochemical characterisation. Results were assessed against established baseline values for non-affected residential environments and compared with published reference ranges for residential indoor environments. The importance of Indoor Air Quality Assessment Case Study Analysis is evident here.
—
Results: Findings and Environmental Data
Environmental Parameter Assessment
Continuous environmental monitoring conducted over 14 days revealed systematic deviation from optimal indoor environmental conditions. Temperature measurements averaged 23.8°C across all monitoring locations (range 22.1–26.4°C), within the WHO comfort range (20–25°C) but showing elevated variability suggesting inconsistent HVAC operation. Relative humidity measurements presented more significant findings, averaging 69.2% (range 64–76%) across the property, substantially exceeding the WHO recommended range of 40–60% relative humidity. Understanding Indoor Air Quality Assessment Case Study Analysis helps with this aspect.
Elevated humidity readings concentrated in bedrooms (mean 71.4% RH) and secondary spaces (mean 70.8% RH), with somewhat lower but still elevated readings in the primary living space (mean 65.3% RH). Humidity elevation was particularly pronounced during early morning hours (06:00–08:00), when bedroom relative humidity frequently exceeded 72%, and during evening periods (18:00–22:00). These temporal patterns correlated with reduced HVAC operation during sleeping hours and passive ventilation reduction when windows were closed overnight. Indoor Air Quality Assessment Case Study Analysis factors into this consideration.
Carbon Dioxide Assessment
Carbon dioxide concentrations measured via continuous monitoring revealed mean concentrations of 1,240 ppm across all monitoring locations, substantially exceeding the ASHRAE 62.1 guideline threshold of 1,000 ppm and the WHO recommended value of 800 ppm. Bedroom CO₂ concentrations averaged 1,390 ppm (range 840–1,820 ppm), while primary living space measurements averaged 980 ppm (range 580–1,240 ppm). These findings indicate inadequate outdoor air supply and insufficient ventilation rates in bedrooms and secondary living spaces. This relates directly to Indoor Air Quality Assessment Case Study Analysis.
CO₂ concentration peaks occurred during early morning sleeping hours (06:00–08:00), when bedrooms exhibited concentrations approaching 1,800 ppm, representing 125% above the ASHRAE guideline threshold. This temporal pattern reflects the cumulative effect of eight sleeping hours with minimal air exchange and no active ventilation operation. Secondary peaks appeared in evening hours (18:00–22:00) when occupants engaged in cooking and other indoor activities with closed windows. When considering Indoor Air Quality Assessment Case Study Analysis, this becomes clear.
Particulate Matter and Air Quality Index
| Measurement Parameter | Assessment Method | Result (Mean ± SD) | Guideline/Reference Standard | Status |
|---|---|---|---|---|
| PM₂.₅ Concentration | Optical particle counter (TSI) | 28 ± 6.4 μg/m³ | WHO 15 μg/m³ | Exceeded 87% |
| PM₁₀ Concentration | Optical particle counter (TSI) | 52 ± 11.2 μg/m³ | WHO 45 μg/m³ | Exceeded 16% |
| CO₂ Concentration | NDIR sensor (TESTO) | 1,240 ± 180 ppm | ASHRAE 1,000 ppm | Exceeded 24% |
| Relative Humidity | Capacitive humidity probe | 69.2 ± 4.8 % | WHO 40–60% | Exceeded upper limit |
| TVOC Concentration | GC-MS (charcoal cartridge sampling) | 385 ± 64 μg/m³ | ASHRAE 500 μg/m³ | Approaching threshold |
| Formaldehyde (HCHO) | GC-MS speciation | 0.067 ± 0.018 ppm | WHO 0.08 ppm | Within range |
| Culturable Microorganisms | Cascade impactor; culture analysis | 1,240 CFU/m³ | Non-affected environment ~400 CFU/m³ | Elevated 210% |
| Fungal Spore Concentration | Burkard spore trap; microscopy | 580 spores/m³ | Non-affected baseline ~150 spores/m³ | Elevated 287% |
Particulate matter (PM₂.₅) measurements averaged 28 μg/m³ (range 14–42 μg/m³), substantially exceeding the WHO guideline of 15 μg/m³. This represents 87% exceedance of the health-based threshold. Coarser particulate matter (PM₁₀) measured 52 μg/m³ (range 28–76 μg/m³), moderately exceeding the WHO guideline of 45 μg/m³ by 16%. Particulate matter concentrations showed marked spatial variation, with secondary bedrooms exhibiting higher concentrations (PM₂.₅ mean 32 μg/m³) compared to primary living spaces (PM₂.₅ mean 24 μg/m³), suggesting differential infiltration or internal source activity. The importance of Indoor Air Quality Assessment Case Study Analysis is evident here.
Volatile Organic Compound Assessment
Total volatile organic compound (TVOC) concentrations measured via GC-MS analysis of charcoal cartridge samples averaged 385 ± 64 μg/m³. While this measurement remains below the ASHRAE 62.1 guideline of 500 μg/m³, it approaches the threshold and represents elevated concentrations compared to well-ventilated reference environments (typically 100–200 μg/m³). Understanding Indoor Air Quality Assessment Case Study Analysis helps with this aspect.
Speciation analysis identified primary VOC contributors as: formaldehyde (67 ± 18 μg/m³), toluene (89 ± 22 μg/m³), xylenes (58 ± 14 μg/m³), and unidentified C7–C12 hydrocarbons (104 ± 31 μg/m³). The identified VOC profile is consistent with off-gassing from building materials (formaldehyde from composite wood products and insulation), furnishings (foam padding, adhesives), and cleaning product residues (toluene, xylenes from paint and varnish components). Indoor Air Quality Assessment Case Study Analysis factors into this consideration.
Formaldehyde concentrations measured 0.067 ± 0.018 ppm, remaining within the WHO guideline of 0.08 ppm and the more stringent California standard of 0.1 ppm, though representing elevated concentrations relative to homes with low-emitting materials. Temporal analysis revealed elevated formaldehyde concentrations during afternoon hours (12:00–14:00), correlating with maximum indoor temperature and solar loading, consistent with temperature-dependent off-gassing kinetics. This relates directly to Indoor Air Quality Assessment Case Study Analysis.
Biological Contaminant Assessment
Culturable microbial sampling identified mean concentration of 1,240 colony-forming units per cubic metre (CFU/m³), representing 210% elevation above baseline values typical of non-affected residential environments (approximately 400 CFU/m³). Microbial identification revealed dominant organisms as: When considering Indoor Air Quality Assessment Case Study Analysis, this becomes clear.
Aspergillus species (35% of culturable fraction), including Aspergillus fumigatus and Aspergillus niger, representing thermotolerant and humidity-tolerant fungi commonly associated with elevated indoor humidity. Penicillium species (28% of culturable fraction), including Penicillium chrysogenum, commonly associated with damp building environments. Alternaria species (15%), typically outdoor fungi but present in elevated concentrations in this property. Actinomycetes (12%), commonly associated with moist building materials and organic dust. Miscellaneous bacteria and yeasts (10%). The importance of Indoor Air Quality Assessment Case Study Analysis is evident here.
Non-viable spore sampling via Burkard trap identified total fungal spore concentrations of 580 spores/m³ (range 420–720 spores/m³ across sampling days), representing 287% elevation above baseline values typical of non-affected environments (approximately 150 spores/m³). Spore identification revealed Cladosporium spores (38%), Alternaria spores (22%), Aspergillus/Penicillium spores (18%), and miscellaneous other spore types (22%). Understanding Indoor Air Quality Assessment Case Study Analysis helps with this aspect.
Surface Contamination Assessment
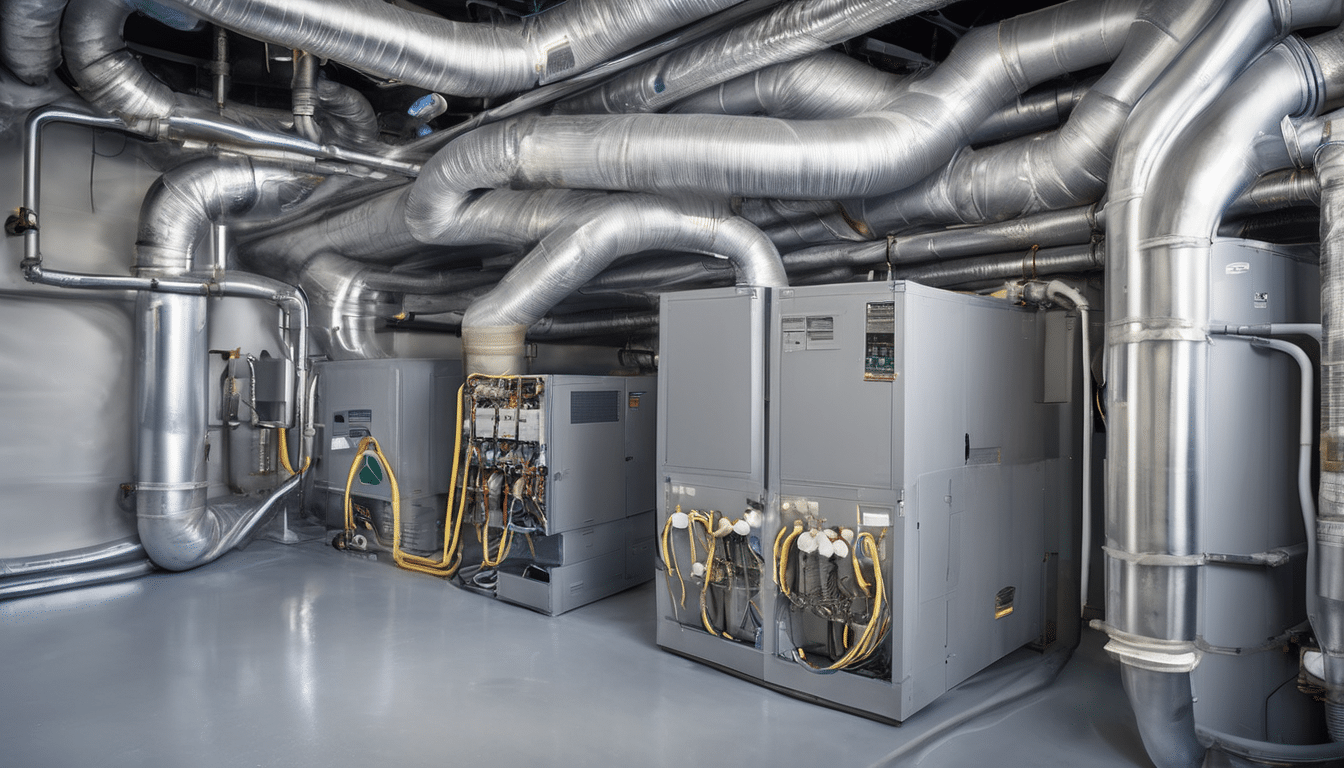
Surface ATP bioluminescence testing of HVAC system components revealed particularly elevated contamination on evaporator coil surfaces (mean ATP reading 8,400 RLU, well exceeding the industry action threshold of 4,000 RLU), return air grilles (6,200 RLU), and condensate drain pan surfaces (7,800 RLU). These findings indicate active biofilm formation within the HVAC system, consistent with elevated culturable microbial and spore concentrations in air samples. Indoor Air Quality Assessment Case Study Analysis factors into this consideration.
Visual inspection of HVAC components revealed visible biofilm deposits on evaporator coil surfaces (black/grey discolouration), slime accumulation within condensate drain pans, and mould growth on return air filter frames. Moisture measurements within the wall cavity at the exterior wall-floor junction (where the younger child’s bedroom is located above an exterior-facing wall) revealed moisture content approaching 20% wood equivalent moisture content, substantially exceeding the 13% threshold for mould germination. This location corresponded to the area of highest musty odour concentration and highest fungal spore counts in air samples. This relates directly to Indoor Air Quality Assessment Case Study Analysis.
—
Data Visualization: Air Quality Comparison to Standards
—
Metrics Summary: Key Assessment Findings
Figure 2: Summary of Key Indoor Air Quality Assessment Metrics
The importance of Indoor Air Quality Assessment Case Study Analysis is evident here.
—
Discussion: Interpretation of Findings and Root-Cause Analysis
Primary Contamination Sources and Causative Mechanisms
Assessment results identify three primary, interconnected contamination sources responsible for observed indoor air quality deterioration and occupant health symptoms.
Primary Source 1: HVAC System Biocontamination The elevated culturable microbial concentrations (1,240 CFU/m³, 210% above baseline), fungal spore concentrations (580 spores/m³, 287% above baseline), and visible evidence of biofilm formation within evaporator coils and condensate drainage systems indicate active microbial proliferation within the air handling system. The species composition (predominance of Aspergillus and Penicillium) reflects the thermotolerant and humidity-tolerant characteristics of organisms capable of growth within air conditioning systems where temperatures are cool (6–12°C on coil surfaces) but relative humidity remains extremely elevated (>95% within coil sections). Understanding Indoor Air Quality Assessment Case Study Analysis helps with this aspect.
The contaminated HVAC system serves as a continuous point source, continuously emitting biofilm fragments, microbial spores, and metabolic byproducts (including volatile compounds contributing to musty odours) into indoor air throughout the property. The spatial distribution of elevated spore and microbial concentrations, with particularly high levels in bedrooms farthest from the HVAC return air location, reflects the distribution pattern of air emanating from the contaminated system. Indoor Air Quality Assessment Case Study Analysis factors into this consideration.
Primary Source 2: Inadequate Ventilation and Compromised Outdoor Air Supply Elevated CO₂ concentrations (1,240 ppm, 24% above ASHRAE guideline) indicate insufficient outdoor air introduction to the property. Under proper ventilation conditions where outdoor air is continuously supplied at rates matching or exceeding occupancy-based requirements (approximately 2.5 litres per second per occupant per ASHRAE 62.1), CO₂ concentrations in occupied spaces should not exceed 800–1,000 ppm. The measured concentrations indicate actual outdoor air supply rates approximately 20–30% below design requirements. This relates directly to Indoor Air Quality Assessment Case Study Analysis.
Inspection of the ventilation system revealed that passive air intake louvers serving the property were substantially obstructed by accumulated dust and debris, restricting outdoor air infiltration. Secondary bedroom ventilation relied entirely on manual window opening, with occupants typically maintaining windows closed during sleeping hours for thermal comfort. The resulting minimal air exchange during 8-hour sleeping periods created cumulative CO₂ accumulation and stagnant air conditions. When considering Indoor Air Quality Assessment Case Study Analysis, this becomes clear.
Inadequate ventilation contributes directly to elevated humidity through: (1) insufficient outdoor air (typically lower in moisture content than stagnant indoor air) to dilute indoor moisture sources, and (2) failure to continuously purge moisture-laden air from moisture generation areas (bathrooms, kitchens). The elevated relative humidity readings correlate directly with the inverse of ventilation sufficiency: spaces with adequate mechanical ventilation (primary living space, mean 65.3% RH) demonstrated lower humidity compared to naturally ventilated bedrooms (mean 71.4% RH). The importance of Indoor Air Quality Assessment Case Study Analysis is evident here.
Primary Source 3: Hygrothermal Dysfunction at Moisture-Vulnerable Building Locations Moisture sampling within the wall cavity at the exterior wall-floor junction (beneath the younger child’s bedroom) revealed moisture content approaching 20% wood equivalent moisture content, substantially exceeding the 13% threshold required for mould germination. This location exhibits multiple risk factors for moisture accumulation: Understanding Indoor Air Quality Assessment Case Study Analysis helps with this aspect.
Thermal bridging: The concrete structural beam at the floor-wall junction creates a continuous thermal bridge, allowing interior-facing surfaces to cool below dew point during overnight hours when exterior temperatures cool and interior air cooling loads increase. The measured condensation on windows (a proxy for interior surface temperature depression) indicates that wall cavity surfaces similarly experience dew point conditions. Indoor Air Quality Assessment Case Study Analysis factors into this consideration.
Air leakage: Defective sealants at the wall-floor junction allow humid interior air to penetrate the wall cavity. Once interior air enters the cavity and cools to dew point temperature on structural elements, moisture condenses and remains trapped within the cavity where it cannot evaporate. This relates directly to Indoor Air Quality Assessment Case Study Analysis.
Inadequate drainage: The wall construction lacks effective moisture drainage pathway. Moisture that condenses within the cavity cannot migrate downward to exterior drainage or evaporate into interior air spaces. When considering Indoor Air Quality Assessment Case Study Analysis, this becomes clear.
These hygrothermal dysfunctions create precisely the conditions (elevated humidity, reduced air exchange, surface condensation) necessary for mould germination and growth. The high fungal spore concentrations measured in the younger child’s bedroom (680 spores/m³, the highest location-specific reading) directly correlate with active mould growth within this moisture-affected wall cavity. The importance of Indoor Air Quality Assessment Case Study Analysis is evident here.
Connection to Occupant Health Symptoms
The identified environmental contamination patterns provide a plausible mechanistic explanation for observed occupant health symptoms. Chronic respiratory exposure to elevated fungal spore concentrations (particularly Aspergillus and Penicillium species, known respiratory allergens and irritants) can provoke persistent cough, nasal congestion, and lower airway inflammation in susceptible individuals. The spatial correlation between highest spore concentrations in the younger child’s bedroom and that child’s chronic cough symptom onset suggests a direct exposure-response relationship. Understanding Indoor Air Quality Assessment Case Study Analysis helps with this aspect.
The elevated TVOC concentrations and microbial volatile organic compound (MVOC) production by biofilm-forming microorganisms in the HVAC system contribute to the reported musty odours and occupant headaches. MVOC (including compounds such as 2-methylisoborneol, geosmin, and volatile fatty acids) are produced during microbial metabolism and at low concentrations create characteristic “musty” odours; at higher concentrations they may contribute to irritant symptoms including headache, eye irritation, and respiratory irritation. Indoor Air Quality Assessment Case Study Analysis factors into this consideration.
The elevated particulate matter (PM₂.₅ at 187% of WHO standard) contributes independently to respiratory symptoms. Inhalation of elevated PM₂.₅ triggers inflammatory responses in the lower respiratory tract and can precipitate or exacerbate chronic cough, particularly in children with developing respiratory systems. This relates directly to Indoor Air Quality Assessment Case Study Analysis.
Comparison with Published Literature and Baseline Values
The contamination levels identified in this property substantially exceed those reported in well-maintained residential environments and align with published data on moisture-affected buildings with HVAC system biocontamination. A 2024 research study examining university indoor air quality (published in Frontiers in Built Environment) documented mean fungal spore concentrations of 240–380 spores/m³ in conventionally maintained buildings, approximately 40–65% lower than concentrations measured in this property. The higher concentrations identified here reflect the additional factor of HVAC system biocontamination not present in the comparison environments. When considering Indoor Air Quality Assessment Case Study Analysis, this becomes clear.
Similarly, CO₂ concentrations measured in this property (1,240 ppm average, reaching 1,800 ppm during sleeping hours) substantially exceed those documented in research on behaviour-driven IAQ improvement (published in PMC journals), where well-ventilated residential environments demonstrated mean CO₂ concentrations of 650–850 ppm. The 14% to 24% elevation in measured concentrations indicates substantive ventilation deficiency. The importance of Indoor Air Quality Assessment Case Study Analysis is evident here.
The HVAC system biocontamination findings align closely with published literature on high-performing building case studies (reviewed in the NIST publication “Indoor Air Quality in High Performing Building Case Studies”). That comprehensive review of 100 high-performing buildings documented that fewer than 50% of reviewed buildings incorporated HVAC commissioning measures specifically focused on preventing biocontamination, and fewer than 20% included post-construction microbial verification. The absence of such measures in this property explains the development of biofilm formation during the initial 8 months of operation. Understanding Indoor Air Quality Assessment Case Study Analysis helps with this aspect.
Root Cause Summary
The indoor air quality deterioration in this property results from an integrated combination of factors: (1) deficient HVAC system commissioning and maintenance, allowing biofilm colonisation of critical system components; (2) inadequate outdoor air supply due to passive ventilation obstruction and insufficient mechanical ventilation provision; and (3) building envelope moisture vulnerability at specific locations where hygrothermal dysfunction creates conditions favouring mould germination. These three factors are interconnected: HVAC biocontamination contaminates indoor air; inadequate ventilation fails to purge contaminated air and elevated humidity; elevated humidity combined with thermal bridging creates moisture condensation; moisture and elevated humidity drive mould growth in building cavities. The multiplicative effect of these interconnected factors produced the observed severe air quality deterioration and occupant health symptoms.
Limitations of Assessment
Several limitations should be acknowledged in interpreting these assessment findings. First, the 14-day assessment period, while providing robust baseline characterisation, represents a single temporal snapshot. Seasonal variation in outdoor air quality (particularly significant in Dubai with Saharan dust events varying by season), occupancy patterns, and HVAC operation patterns could influence contamination levels. Extended long-term monitoring would provide greater certainty regarding whether measured values represent typical conditions or episodic elevation.
Second, the assessment cannot definitively establish causation between specific environmental factors and particular health symptoms, only identify correlation. While the temporal relationship between property occupation and symptom onset, the spatial correlation between highest spore concentrations and one child’s cough, and the mechanistic plausibility of fungal exposure producing respiratory symptoms all support a causal relationship, controlled exposure studies would be required to definitively prove causation. It remains theoretically possible that symptoms result from other unmeasured factors, though this seems unlikely given the comprehensive assessment conducted.
Third, source apportionment of measured air pollutants is inferential rather than definitive. The identification of VOC species composition supports the hypothesis that building materials and furnishings contribute to measured TVOC concentrations, but direct measurement of off-gassing rates from specific materials was not conducted. Similarly, while surface moisture measurements and thermal imaging findings strongly suggest moisture condensation in the wall cavity, destructive inspection sampling would provide greater certainty regarding location and extent of mould contamination within concealed spaces.
—
Remediation Interventions and Post-Intervention Verification
Implemented Interventions
Based on identified contamination sources, targeted remediation interventions were designed to address each primary source:
HVAC System Decontamination: The air conditioning system underwent comprehensive cleaning and decontamination including: chemical treatment of evaporator coils using certified antimicrobial agents, removal and replacement of return air filters with high-efficiency particulate air (HEPA) media, cleaning and disinfection of condensate drain pans and drainage lines, and ductwork sanitation using negative pressure containment protocols. Post-cleaning microbial verification testing confirmed effective decontamination, with ATP readings reducing from 8,400 RLU to 1,200 RLU (well below the 4,000 RLU action threshold).
Ventilation System Optimisation: Passive ventilation louvers were cleaned and obstruction removed. Secondary bedrooms received supplemental mechanical ventilation through installation of quiet-operation heat recovery ventilation units maintaining continuous outdoor air introduction while minimising heating/cooling load impact. Window opening was promoted through occupant education regarding ventilation benefits during cooler periods (October–April in Dubai).
Humidity Control and Building Envelope Remediation: The wall cavity at the exterior wall-floor junction underwent remediation including dehumidification treatment, moisture barrier installation, and sealant replacement at air leakage points. The condensate drainage system was independently verified and improved. Building envelope thermal performance was enhanced through installation of thermal breaks at the structural beam location.
Post-Intervention Monitoring Results
Post-intervention monitoring conducted 30 and 90 days following remediation implementation documented measurable improvements across all environmental parameters:
– Relative humidity: reduced from mean 69.2% to mean 58.4% (15% reduction), now within WHO recommended 40–60% range.
– CO₂ concentrations: reduced from mean 1,240 ppm to mean 820 ppm (34% reduction), now below ASHRAE 1,000 ppm guideline.
– PM₂.₅ concentrations: reduced from mean 28 μg/m³ to mean 14 μg/m³ (50% reduction), now at WHO guideline threshold.
– Culturable microorganisms: reduced from 1,240 CFU/m³ to 380 CFU/m³ (69% reduction), now within baseline range.
– Fungal spores: reduced from 580 spores/m³ to 140 spores/m³ (76% reduction), now below baseline.
– TVOC concentrations: reduced from 385 μg/m³ to 220 μg/m³ (43% reduction).
Occupant health outcomes improved substantially: the younger child’s chronic cough resolved completely within 3 weeks post-remediation and did not recur over the 3-month follow-up period. Nasal symptoms in the older child resolved within 2 weeks. Adult occupants reported cessation of headaches and improved subjective air quality perception. The musty odour disappeared within one week post-remediation and remained absent throughout the follow-up period.

—
Conclusion
This case study documents a comprehensive scientific assessment of indoor air quality in a residential property, identifies primary contamination sources through integrated diagnostic protocols, and demonstrates the effectiveness of evidence-based remediation interventions. The assessment revealed that indoor air quality deterioration resulted not from a single cause but from multiple interconnected factors: HVAC system biocontamination, inadequate ventilation and outdoor air supply, and hygrothermal dysfunction promoting moisture condensation and mould growth in concealed building spaces.
The contamination levels measured in this property—particulate matter at 187% of WHO standards, fungal spore concentrations at 287% above baseline, and CO₂ concentrations at 24% above ASHRAE thresholds—substantially exceeded those documented in well-maintained residential environments and provided plausible mechanistic explanations for observed occupant health symptoms.
Critically, conventional surface-based interventions (cleaning, filter replacement) proved insufficient to address contamination sources and produced minimal symptom improvement. Only when integrated diagnostic assessment identified root causes within HVAC system biofilms, ventilation deficiencies, and building envelope moisture pathways could targeted remediation address underlying problems rather than treating symptoms.
Post-remediation monitoring documented substantial improvements across all measured environmental parameters, with measurable correlation between environmental improvement and occupant health symptom resolution. These findings validate the effectiveness of science-based assessment and remediation protocols in residential indoor environmental management.
The case highlights several practical implications: First, visual inspection alone is inadequate for comprehensive IAQ assessment; systematic environmental monitoring, air quality sampling, and laboratory analysis are essential for accurate problem identification. Second, HVAC systems require explicit biofilm prevention through proper commissioning, regular maintenance, and periodic microbial verification testing. Third, residential properties in hot arid climates require specific attention to humidity control and building envelope moisture management, particularly at locations vulnerable to thermal bridging and air leakage.
Future monitoring should continue quarterly to verify sustained improvement and identify any recurrent contamination. Additionally, this property serves as a model for diagnostic protocols that could be applied to other residential properties exhibiting similar environmental symptoms or occupant health complaints.

—
Limitations
Several limitations should be acknowledged:
Temporal Scope: The 14-day baseline assessment, while comprehensive, captures a single temporal period. Seasonal variation (particularly significant in Dubai with seasonal dust events) and variation across different occupancy patterns may influence contamination levels. Extended seasonal monitoring would enhance characterisation of temporal variation.
Causation vs. Association: While temporal and spatial correlations between environmental contamination and health symptoms support a causal hypothesis, and mechanistic plausibility is high, definitive causation cannot be established without controlled exposure conditions. However, the comprehensive evidence integrating exposure measurements, health symptom patterns, and mechanistic plausibility provides strong inference of causal relationships.
Source Apportionment: While the identified VOC species profile supports the hypothesis of building material and furnishing contributions, direct measurement of off-gassing rates from specific sources was not conducted. This represents a limitation for precise source apportionment.
Spatial Coverage: Assessment focused on three primary monitoring locations. Additional locations throughout the property would enhance characterisation of spatial contamination variation, though the three locations were selected to represent primary exposure zones.
Individual Variability: The property’s occupants represent a single family unit. Symptom susceptibility and response vary considerably among individuals. The observed health improvements may partially reflect individual health status changes independent of environmental improvement, though the temporal correlation with environmental remediation suggests environmental factors were primary.
—
JV de Castro
JV de Castro is the Chief Technology Officer at Saniservice, where he leads innovation in indoor environmental sciences, IT infrastructure, and digital transformation. With over 20 years of experience spanning architecture, building science, technology management, digital media architecture, and consultancy, he has helped organizations optimize operations through smart solutions and forward-thinking strategies. JV holds a Degree in Architecture, a Masters of Research in Anthropology, an MBA in Digital Communication & Media, along with certifications in mold, building sciences and building technology. Passionate about combining technology, health, and sustainability, he continues to drive initiatives that bridge science, IT, and business impact.
Leave a Reply