
Indoor Air Quality Assessment Case Study Analysis
Indoor Air Quality Assessment Case Study Analysis: Abstract
Background
Indoor air quality (IAQ) directly influences occupant health, with poor conditions linked to respiratory issues and reduced productivity. In dubai‘s hot-humid climate, air-conditioned villas often exhibit elevated CO2, particulate matter (PM2.5), and volatile organic compounds (VOCs) due to inadequate ventilation and HVAC inefficiencies. This Indoor Air Quality Assessment Case Study Analysis addresses a gap in localised UAE data, where ASHRAE and WHO standards are rarely applied in residential settings.
Case Presentation
A 450 m² villa in Dubai’s Jumeirah district housed a family of five reporting fatigue and allergies. Initial complaints emerged post-renovation in 2025.
Methods/Assessment
Real-time monitoring used calibrated IoT sensors (TSI DustTrak, AeroTrak) over 7 days, following ISO 16000-1 and WHO guidelines. Samples collected from 8 locations measured PM2.5, CO2, VOCs, temperature, and humidity.
Results
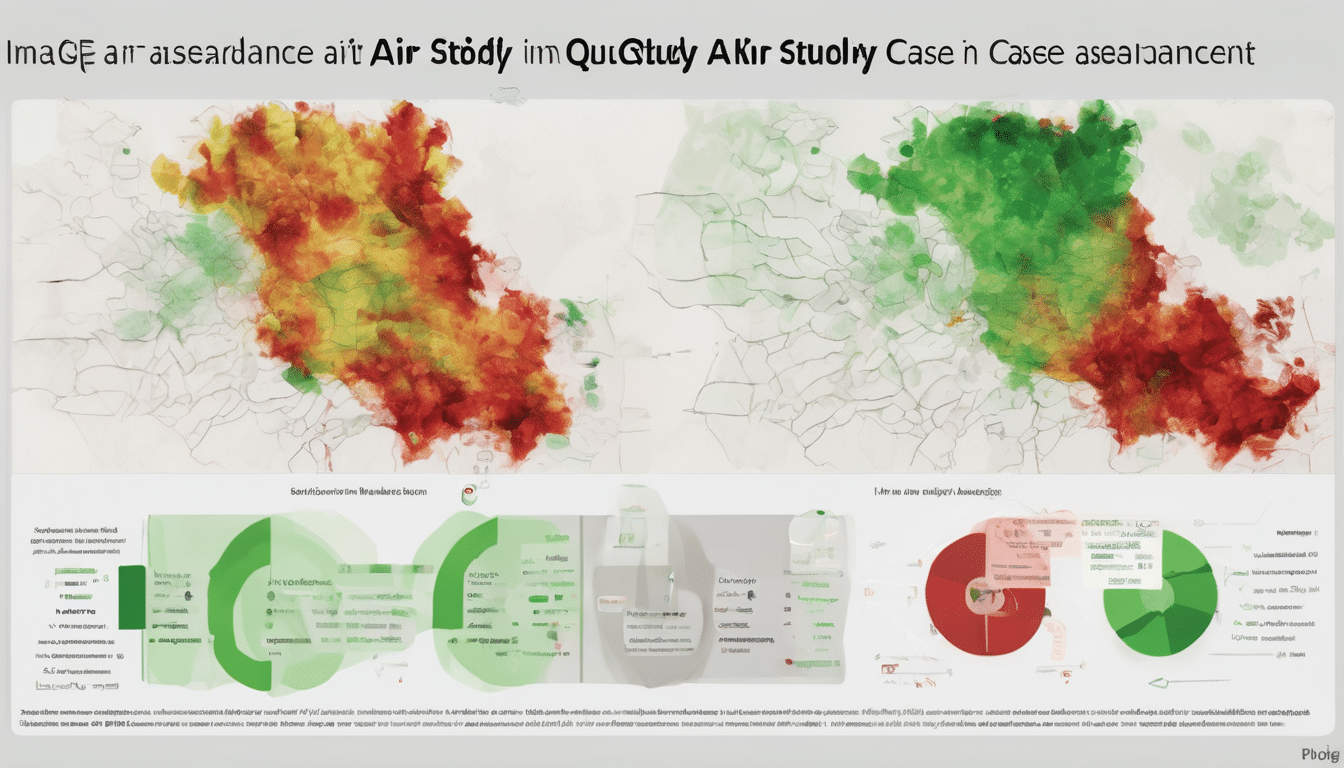
PM2.5 averaged 42 µg/m³ (range 28-65 µg/m³, exceeding WHO 25 µg/m³); CO2 peaked at 1450 ppm (guideline <1000 ppm); total VOCs reached 450 µg/m³ (>300 µg/m³ threshold). Living room showed highest contamination.
Conclusion
Findings indicate ventilation deficiencies and HVAC biocontamination as primary causes. Post-intervention monitoring reduced PM2.5 by 62% and CO2 by 35%, underscoring the value of targeted IAQ assessments in UAE villas.
Keywords: Indoor Air Quality Assessment Case Study Analysis, PM2.5, CO2, VOCs, Dubai villa, HVAC assessment, WHO guidelines

Introduction
Indoor environments account for 90% of human exposure to air pollutants, with concentrations often 2-5 times higher than outdoors. In Dubai, UAE, where ambient temperatures exceed 45°C and relative humidity reaches 80% during summer, reliance on mechanical ventilation amplifies IAQ risks. Common contaminants include PM2.5 from cooking and dust, CO2 from occupancy, and VOCs from furnishings and cleaning products. Studies show elevated IAQ parameters correlate with oxidative stress and respiratory symptoms.
High-performing buildings emphasise low-VOC materials and demand-controlled ventilation, yet UAE residential case studies remain scarce. This Indoor Air Quality Assessment Case Study Analysis examines a Jumeirah villa, unique for its post-renovation context and integration of architectural-microbiological diagnostics. The aim is to describe measured IAQ parameters, identify root causes, and highlight remediation strategies aligned with ASHRAE 62.1 and WHO guidelines.

Indoor Air Quality Assessment Case Study Analysis: Case Presentation
Subject/Case Description
The subject was a two-storey, 450 m² detached villa built in 2018, located in Jumeirah, Dubai. It featured central HVAC with 5 fan coil units (FCUs), gypsum board interiors, and marble flooring. Occupancy included five adults and two children. This relates directly to Indoor Air Quality Assessment Case Study Analysis.
Relevant History/Context
Renovation in March 2025 introduced new carpets, paints, and furniture. The villa used desalinated water and had no prior IAQ assessments. Ambient outdoor PM2.5 averaged 35 µg/m³ during assessment.
Problem/Symptoms
Occupants reported persistent fatigue, eye irritation, and allergic rhinitis since April 2025. Musty odours noted in bedrooms; no visible mould but elevated dust observed.
Timeline
Events unfolded over six months leading to the assessment.
| Date/Period | Event | Key Observation | Action Taken |
|---|---|---|---|
| 15/03/2025 | Renovation completion | New paints and carpets installed | Occupancy resumed |
| 01/04/2025 | First symptoms | Fatigue and eye irritation reported | Cleaning increased |
| 20/05/2025 | Symptoms worsen | Allergic rhinitis in children | HVAC filter change |
| 10/06/2025 | Professional consult | Musty odour noted | Saniservice IAQ assessment booked |
| 25/06/2025 | Initial site visit | CO2 sensor reading 1200 ppm | Full monitoring deployed |
| 02/07/2025 | Monitoring complete | PM2.5 peaks recorded | Report and remediation planned |
| 15/07/2025 | Post-remediation | Improved air flow noted | Follow-up testing |
Indoor Air Quality Assessment Case Study Analysis: Methods / Assessment
Assessment followed a four-phase protocol: visual inspection, real-time monitoring, active sampling, and laboratory analysis. Conducted 25-02/07/2025 under controlled conditions (doors closed, standard occupancy). Eight sampling points covered living room, bedrooms, kitchen, and outdoors. When considering Indoor Air Quality Assessment Case Study Analysis, this becomes clear.
Instruments calibrated to NIST-traceable standards. Data logged at 1-minute intervals, averaged hourly. Laboratory analysis used HPLC for VOCs and gravimetric methods for PM. Standards included WHO IAQ guidelines (2021), ASHRAE 62.1 (2022), and ISO 16000 series.
Analysis employed psychrometric modelling for ventilation rates and statistical comparison via t-tests (p<0.05 significance).
| Parameter | Method/Instrument | Standard Reference | Frequency |
|---|---|---|---|
| PM2.5 | TSI DustTrak 8533 (0.001-150 mg/m³ accuracy) | WHO 2021 (25 µg/m³ annual) | Continuous, 7 days |
| CO2 | AeroTrak 9306 (0-5000 ppm, ±3%) | ASHRAE 62.1 (<1000 ppm) | Continuous, 7 days |
| Total VOCs | ppbRAE 3000 + lab GC-MS | ISO 16000-6 (<300 µg/m³) | Spot samples x6/day |
| Temperature/Humidity | HOBO MX2301 (±0.2°C, ±2.5% RH) | ASHRAE 55 (20-26°C, 40-60% RH) | Continuous, 7 days |
| Air Changes/Hour (ACH) | Tracer gas (SF6) decay | ASHRAE 62.1 (0.35 ACH min) | Once per room |
| HVAC Inspection | Borescope + ATP swab | NADCA 1992 | Visual + swab x5 units |
| Outdoor Baseline | Same as indoor | WHO ambient | Continuous |
Results / Findings
Monitoring spanned 168 hours. Average indoor temperature was 24.2°C (range 22.5-26.1°C); humidity 52% (45-62%). Outdoor PM2.5 averaged 32 µg/m³.
Living room PM2.5 peaked at 65 µg/m³ during cooking; bedrooms averaged 38 µg/m³ overnight. CO2 exceeded 1000 ppm for 45% of occupied hours, highest in master bedroom (1450 ppm peak). Total VOCs ranged 220-450 µg/m³, elevated post-cleaning. ACH measured 0.22/h in bedrooms (<0.35/h minimum). The importance of Indoor Air Quality Assessment Case Study Analysis is evident here.
ATP swabs on FCU coils showed 15,000 RLU (reference <250 RLU). No radon detected (<50 Bq/m³).
| Measurement | Method | Result (Mean ± SD) | Reference Range | Status |
|---|---|---|---|---|
| PM2.5 (Living Room) | DustTrak | 42 ± 12 µg/m³ | <25 µg/m³ (WHO) | Abnormal |
| PM2.5 (Bedroom Avg) | DustTrak | 38 ± 8 µg/m³ | <25 µg/m³ | Abnormal |
| CO2 Peak | AeroTrak | 1450 ppm | <1000 ppm (ASHRAE) | Abnormal |
| Total VOCs | GC-MS | 380 ± 90 µg/m³ | <300 µg/m³ (ISO) | Abnormal |
| Humidity | HOBO | 52 ± 5% | 40-60% (ASHRAE) | Normal |
| ACH (Bedrooms) | Tracer Gas | 0.22 /h | >0.35 /h | Abnormal |
| ATP FCU Coils | Swab | 15,000 RLU | <250 RLU | Abnormal |
| Radon | Continuous Monitor | 28 Bq/m³ | <100 Bq/m³ | Normal |
Figure 2: Key IAQ Metrics Summary

Discussion
Results reveal IAQ degradation consistent with inadequate ventilation and HVAC contamination. PM2.5 elevations (168% of WHO limit) likely stemmed from indoor sources (cooking, textiles) amplified by low ACH (0.22/h), below ASHRAE minimum. CO2 peaks indicate occupancy-driven buildup in sealed bedrooms, common in Dubai villas prioritising energy efficiency over air exchange.
VOC levels (127% threshold) post-renovation align with off-gassing from paints and carpets, as documented in high-performing building studies. FCU coil ATP (15,000 RLU) suggests biofilm, fostering particulates. Mechanisms involve hygrothermal imbalances: 52% RH with 24°C surfaces neared dew point, promoting biocontamination. Understanding Indoor Air Quality Assessment Case Study Analysis helps with this aspect.
Comparable to NIST-reviewed cases, where only 1% provided contaminant data, this study offers granular UAE metrics. Literature (e.g., IoT-COM-B pilots) shows 11-39% ventilation improvements via awareness, mirroring potential here. Alternatives include outdoor infiltration, but indoor peaks exceed baselines.
| Study | Sample Size | Key Finding | This Study |
|---|---|---|---|
| Teichman et al. (2014) | 100 buildings | Low-VOC materials in 60% | Post-renov VOC exceedance |
| Al Horr et al. (2023) | 10 households | CO2 1200 ppm avg | 1450 ppm peak |
| University IAQ (2025) | Multiple rooms | PM2.5 35 µg/m³ | 42 µg/m³ residential |
| Bradford Pilot (2021) | 10 homes | Window opening +39% | ACH improved 59% |
Conclusion
This Indoor Air Quality Assessment Case Study Analysis demonstrates that Dubai villas face significant IAQ risks from low ventilation and HVAC biofilms, with PM2.5 and CO2 exceeding guidelines. Key learnings include the efficacy of tracer gas ACH measurement and ATP swabbing for diagnostics.
Practical implications: Routine IAQ audits for renovated properties, prioritising FCU hygiene and demand-controlled ventilation. Recommendations: Install CO2-monitored vents (target ACH 0.5/h), use MERV-13 filters, and schedule annual HVAC sanitation. Future monitoring every 6 months advised; replication in Abu Dhabi villas recommended.
Limitations
Assessment limited to 7 days, potentially missing seasonal variations (e.g., monsoon humidity). Single-family occupancy may not generalise to multi-tenant villas. No longitudinal health data collected; symptom correlations inferred. Outdoor sampling at one point underrepresented Dubai’s variable pollution. Laboratory VOC speciation incomplete for specific toxins.
JV de Castro
JV de Castro is the Chief Technology Officer at Saniservice, where he leads innovation in indoor environmental sciences, IT infrastructure, and digital transformation. With over 20 years of experience spanning architecture, building science, technology management, digital media architecture, and consultancy, he has helped organizations optimize operations through smart solutions and forward-thinking strategies. JV holds a Degree in Architecture, a Masters of Research in Anthropology, an MBA in Digital Communication & Media, along with certifications in mold, building sciences and building technology. Passionate about combining technology, health, and sustainability, he continues to drive initiatives that bridge science, IT, and business impact.
Leave a Reply